Query logs
![]() Loki is the storage system for logs. It is a horizontally-scalable, highly-available, multi-tenant log aggregation system inspired by Prometheus and lead by Grafana Labs.
Loki is the storage system for logs. It is a horizontally-scalable, highly-available, multi-tenant log aggregation system inspired by Prometheus and lead by Grafana Labs.
Loki is made of many components including distributors and ingesters (ingest and store the logs in S3) and queriers (query S3 and report the result to the query tool, usually Grafana)
LogQL
To query logs, Loki use logQL : Log Query Language.
See LogQL documentation for more details.
LogQL can be used in the Grafana explore tab with Loki datasource.
Then we can choose to view the logs or number of logs.
Logs
Logs stream selector
We choose a log stream selector. The stream selector is comprised of one or more key-value pairs, where each key is a log label and the value is that label's value.
In the stream selector you can use different operators :
=(exactly equal)!=(not equal)=~(regex matches)!~(regex does not match)
Example :
{app="eventrouter",namespace="caascad-eventrouter"}
This example retrieves all the log lines with labels app="eventrouter" and namespace="caascad-eventrouter".
Log pipeline
We can also then filter the content of expressions.
The search expression can be just text or regex.
In the search expression you can use different operators :
|=: Log line contains string.!=: Log line does not contain string.|~: Log line matches regular expression.!~: Log line does not match regular expression.
Example:
{app="eventrouter",namespace="caascad-eventrouter"} |= "UPDATED"
This example retrieves all the log lines :
- with labels
app="eventrouter"andnamespace="caascad-eventrouter" - containing
UPDATEDworld
Note
In Grafana, the maximum number of log lines obtained in a single request is 1000 lines. To get old logs, you have to move the search time in the past.
Log parser
We can parse the logs to extract the labels during the request.
The available parsers are :
- json
- logfmt
- regexp
- pattern
Example of use for log
Without parser:
{app="promtail"}

With logfmt parser:
{app="promtail"} | logfmt
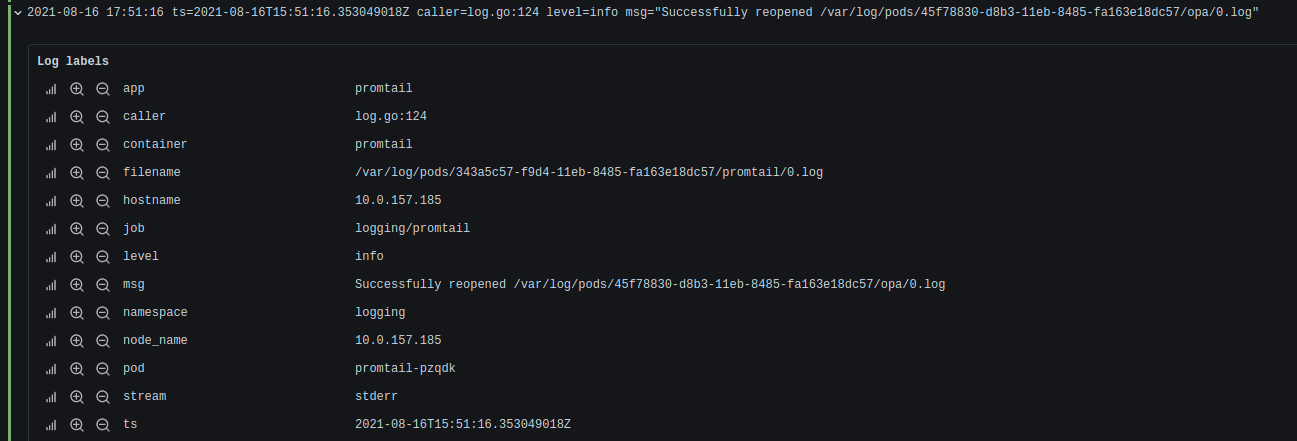
We can see that we have additional labels like : level, msg...
When there is a problem during parsing, a label __error__=JSONParserErr is added:
{app="promtail"} | json

With pattern parser:
{container="nginx"} | pattern "<_> - - [<_>] <code> \"<method> <uri> <_>"
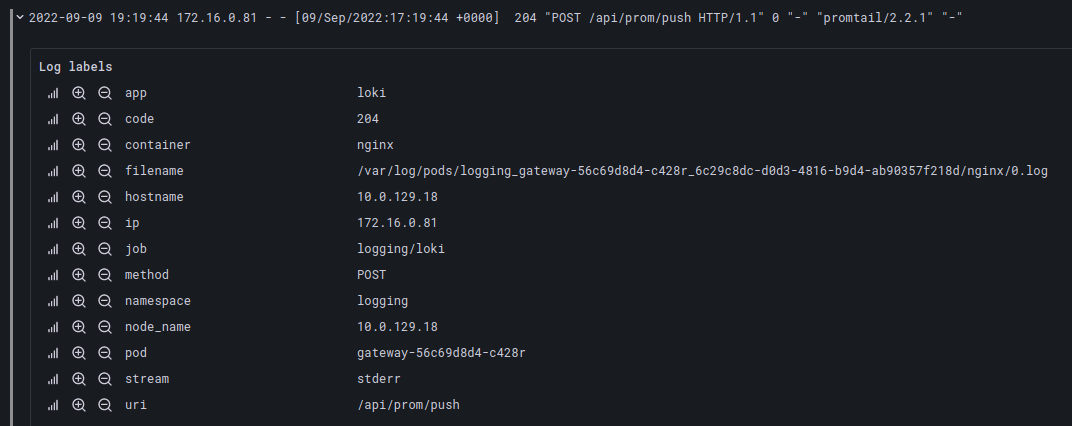
We can see that the code, method and uri labels are present.
Tip
To use this parser, you can:
- get a log line, in the example:
172.16.0.225 - - [09/Sep/2022:17:25:37 +0000] 204 "POST /api/prom/push HTTP/1.1" 0 "-" "promtail/2.2.1" "-" - replace the desired information with the name of the label placed between
< >:172.16.0.225 - - [09/Sep/2022:17:25:37 +0000] <code> "<method> <uri> HTTP/1.1" 0 "-" "promtail/2.2.1" "-" - replace unwanted information with a
_in< >:<_> - - [<_>] <code> \"<method> <uri> HTTP/1.1" <_>Warning: the"in the log lines must be escaped.
Log filter
We can filter on the labels extracted during the request.
Example of use for log
{app="promtail"} | logfmt | level="error"

{app="promtail"} | logfmt | level="info"

Several operations are possible:
- with strings:
=,!=,=~,!~ - with number, duration, bytes:
=,!=,<,>,<=,>=
Rewriting logs
We can rewrite the logs using their labels.
Examples:
{app="promtail"} | logfmt | line_format "pod={{.pod}} msg={{.msg}}"

{app="promtail"} | logfmt | line_format "level={{.level | ToUpper}} msg={{.msg}}"

The functions that are available are here.
Rewriting labels
We can rewrite the log labels.
Example:
{app="promtail"} | logfmt | label_format pod="{{.namespace}}/{{.pod}}/{{.container}}"
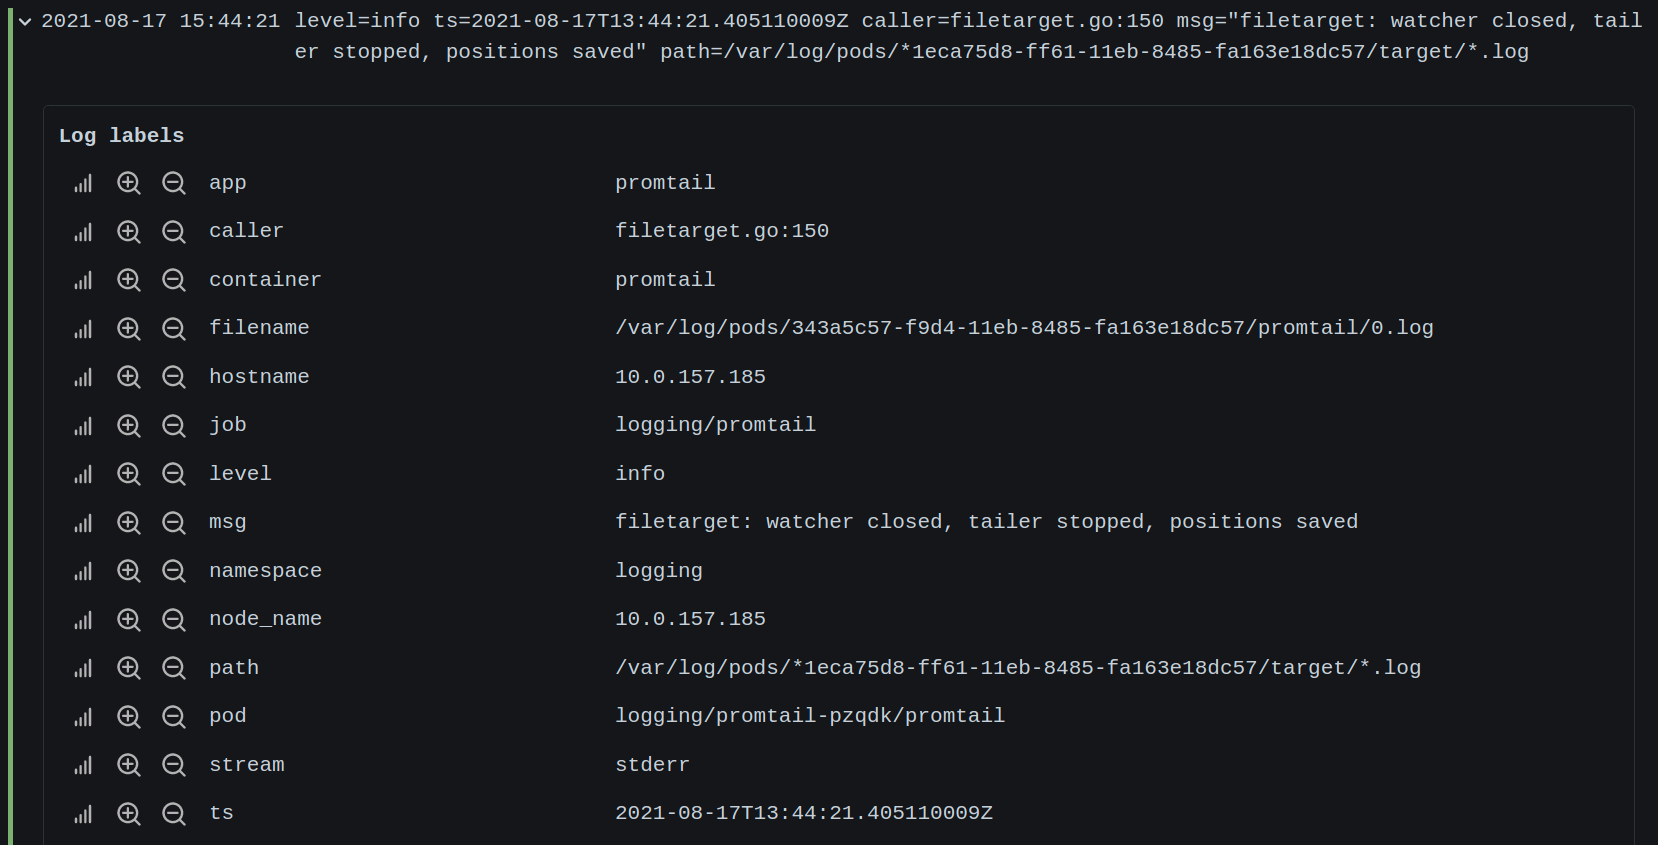
The pod label has been rewritten with the namespace, pod and container labels.
We can use the same functions as for rewriting logs.
Graph
We can use extracted labels as sample values instead of log lines.
Example :
{container="blackbox-exporter"} | logfmt
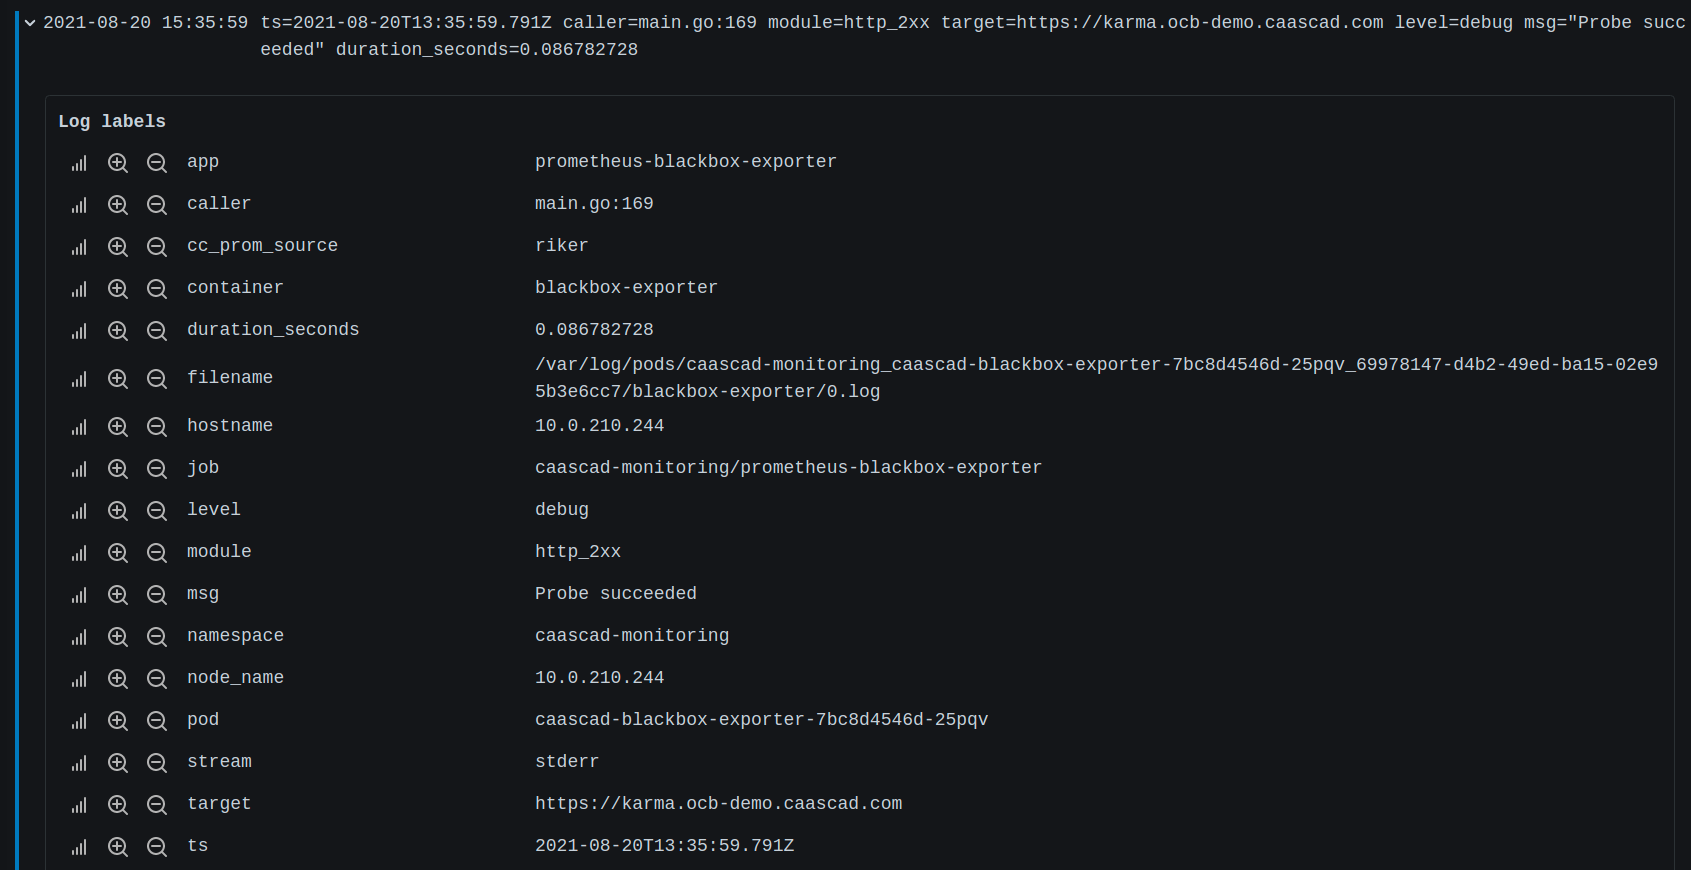
avg(avg_over_time({container="blackbox-exporter"} | logfmt | unwrap duration_seconds | __error__="" [1h])) by (module, target)
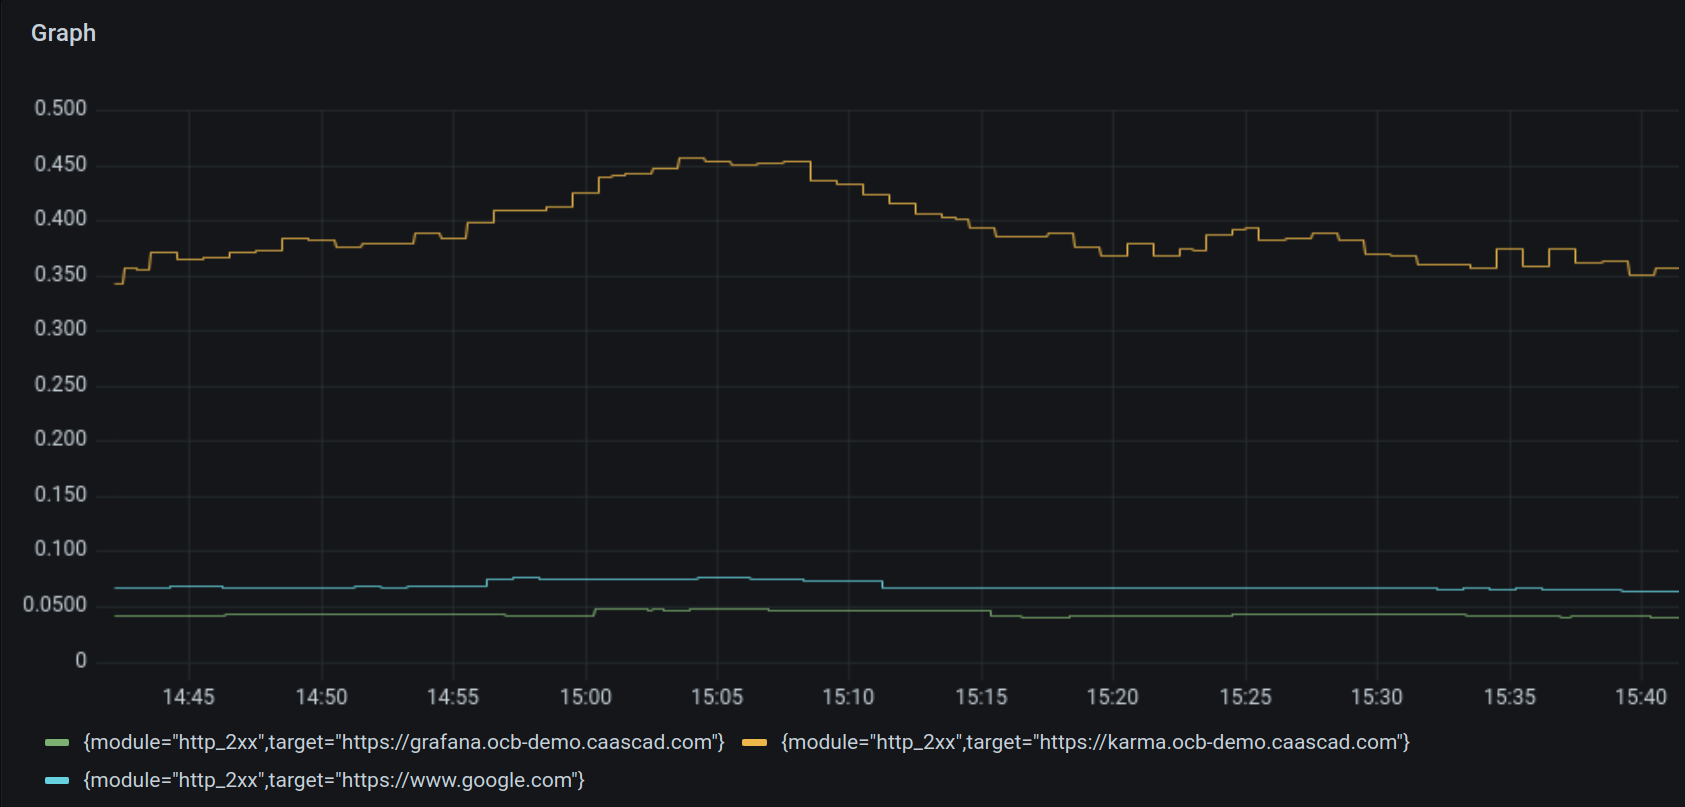
We use the duration_seconds label and we do an average over a period of 1 hour, aggregating on the module and target labels.
We specify __error __ =" " for logs which do not have the duration_seconds label.
By default the label duration_seconds is converted to float (64bits).
Several functions are possible, like avg_over_time, max_over_time, min_over_time. See official documentation for more details.
Number of entries
We can count the entries by stream.
The main supported functions for operating over are:
rate: calculate the number of entries per secondcount_over_time: counts the entries for each log stream within the given range.sum: Calculate sum over labelsmin: Select minimum over labelsmax: Select maximum over labelsavg: Calculate the average over labelsstddev: Calculate the population standard deviation over labelsstdvar: Calculate the population standard variance over labelscount: Count number of elements in the vectorbottomk: Select smallest k elements by sample valuetopk: Select largest k elements by sample value
Example:
count_over_time({app="eventrouter",namespace="caascad-eventrouter"}[5m])
This example counts all the log lines within the last five minutes for logs with labels app="eventrouter" and namespace="caascad-eventrouter".