Grafana
![]() Grafana is a Graphical User Interface (GUI) for several tools including Prometheus & Thanos metrics and Loki logs.
Grafana is a Graphical User Interface (GUI) for several tools including Prometheus & Thanos metrics and Loki logs.
Grafana is an analytics platform that allows to visualize metrics collected by Prometheus, build dashboards with metrics, visualize logs and filter logs.
Note
In this tutorial, please replace the following values:
ZONE_NAMEwith the name of the administrative zone (it starts withocb-).
Grafana access
You will find, in your administration environment, Grafana service at this address:
https://grafana.ZONE_NAME.caascad.com
Login
To be able to login into Grafana, you first need your Keycloak credentials. For more info regarding Keycloak, please refer to Authentication page.
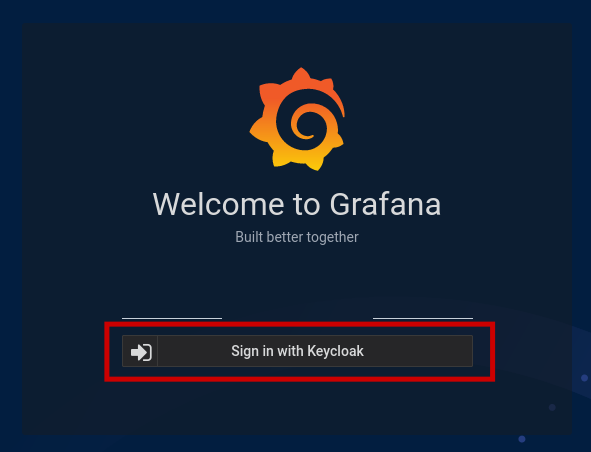
At first connection, you are asked for a login/password or to sign in with Keycloak. Choose Keycloak authentication button :
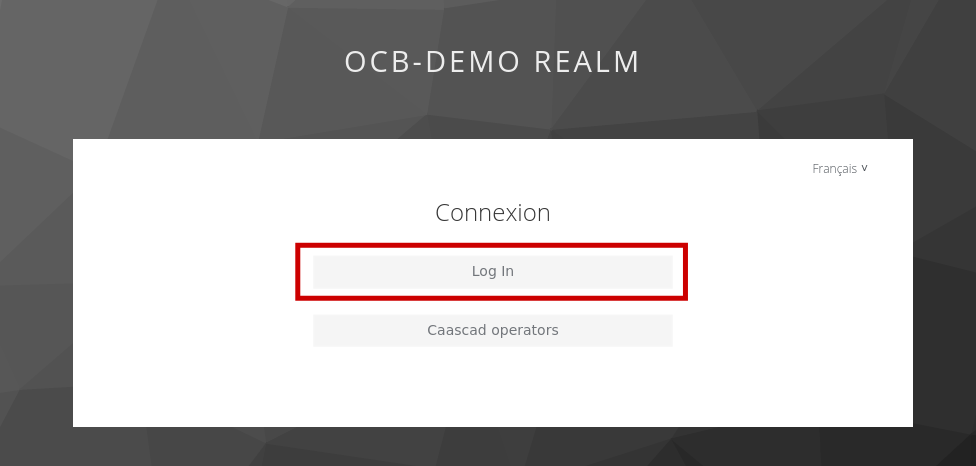
Then you will be redirected to Keycloak authentication :
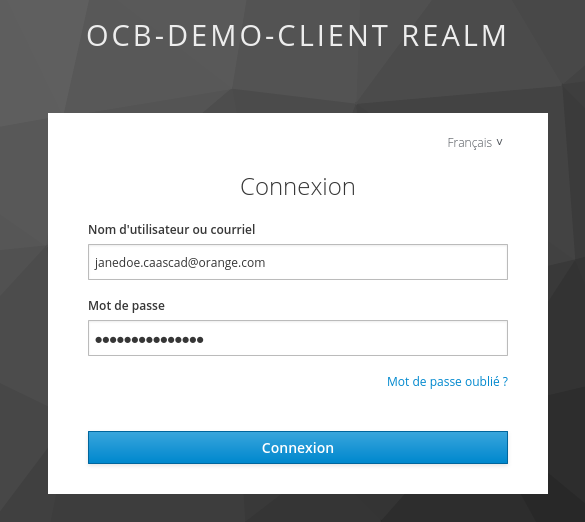
And then enter you User / Password:
Once logged in you will be landing on this page:
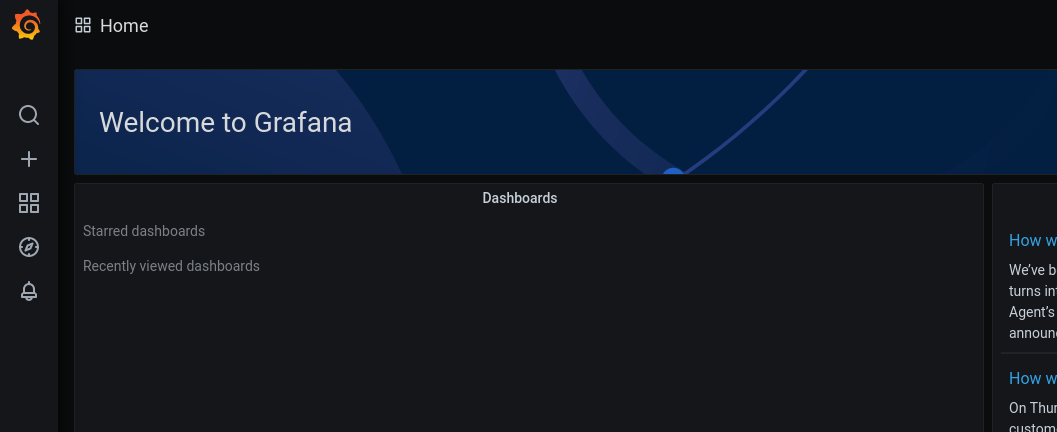
You are now ready to use Grafana.
Password reset disabled
Password reset from Grafana is now disabled for security reasons.
The endpoint /user/password/send-reset-email is not longer accessible with the normal path. But, if you ever come across this page, you will not be authorized to reset your password:
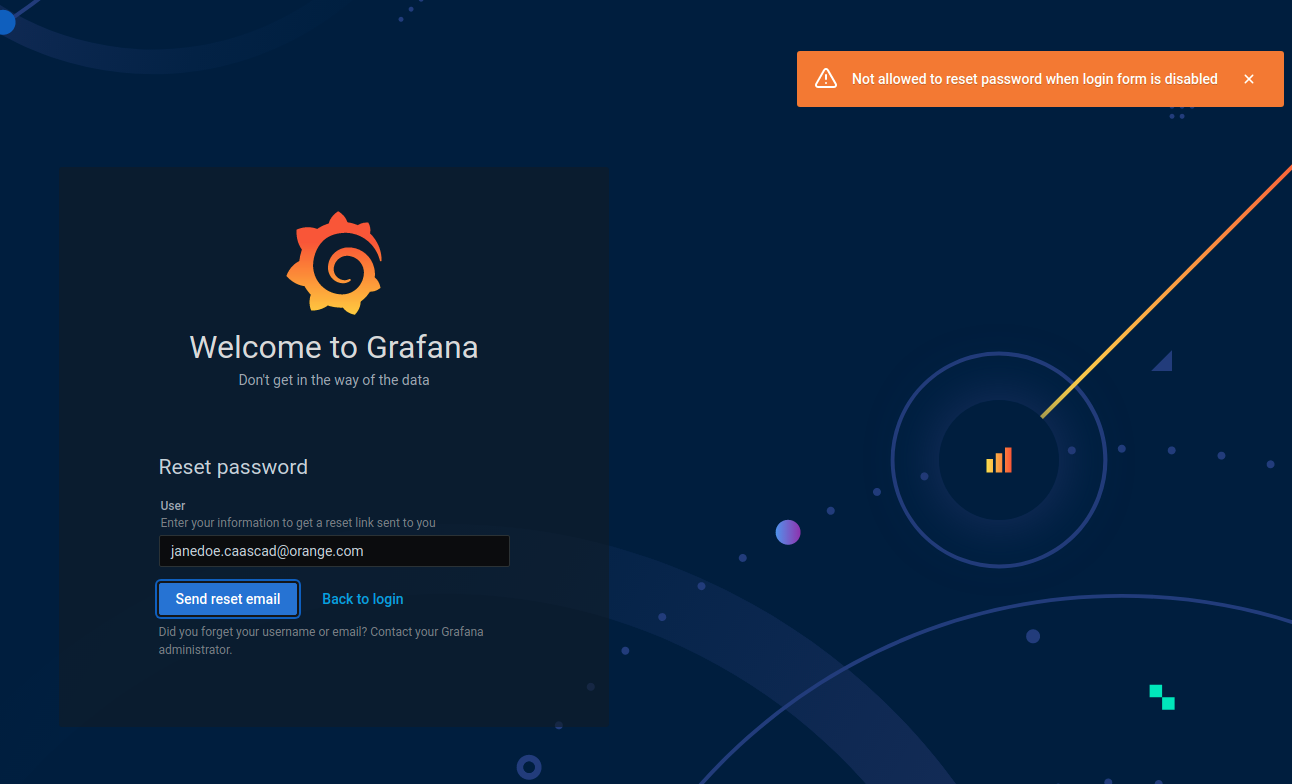
Authentication is not handled by Grafana, but by Keycloack. If you need to reset your password, please use the Keycloack password reset URL.
Select Datasource
In Grafana, in most dashboards and in the Explore tab, you can select a Datasource.
A datasource is some kind of database where the metrics or logs you want to visualize are stored in.
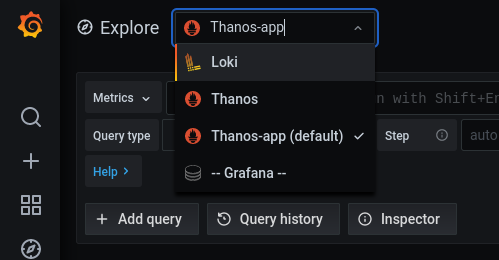
There are 3 Caascad datasources :
Loki(UIDloki): select this datasource if you want to visualize logs.Thanos(UIDthanos): select this datasource if you want to see S3 metrics managed by Caascad Teams. This datasource also contains system metrics that Caascad Teams need for managing your clusters.Thanos-app(UIDthanos_app): select this datasource if you want to visualize metrics.
Tips
Other built-in datasources like -- Grafana -- may appear. Check the Official documentation for more information.
Visualize metrics
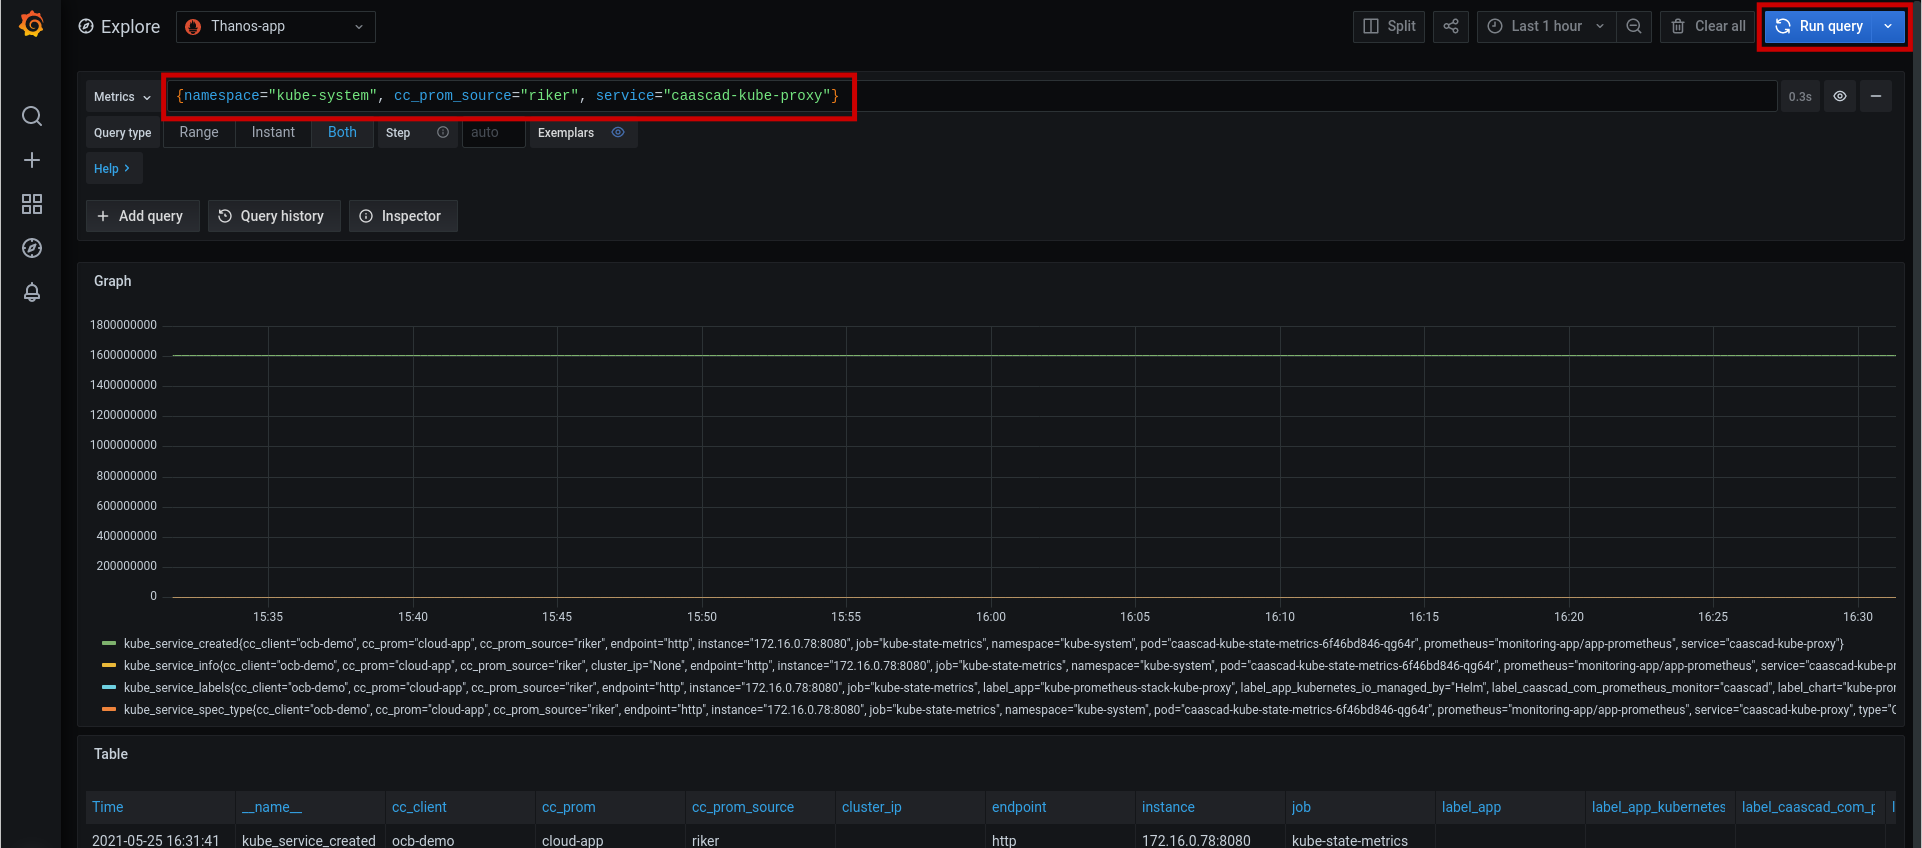
Go on Explore tab. Then select Thanos-app datasource
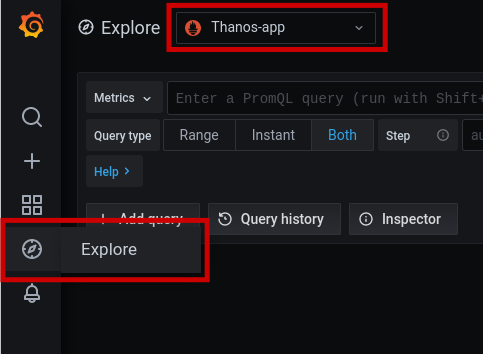
Type a PromQL expression and Run Query (blue button at top right).
Tips
Instead of clicking on Run Query, you can also type Shift-Enter on your keyboard.
Tips
In most cases, you will start with a basic expression with cc_prom_source and namespace to specify the cluster and the namespace where your metrics are. Then you will improve your expressions with other labels using the Grafana auto-completion.
Example : in the above screenshot, we started with the expression {cc_prom_source="riker", namespace="kube-system"}. Then we improved the expression by adding the service label : {cc_prom_source="riker", namespace="kube-system", service="caascad-kube-proxy"}.
Check PromQL reference for help on PromQL expressions.
Visualize logs
Go on Explore tab. Then select Loki datasource
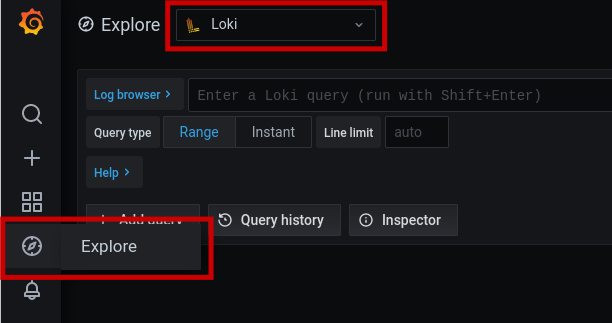
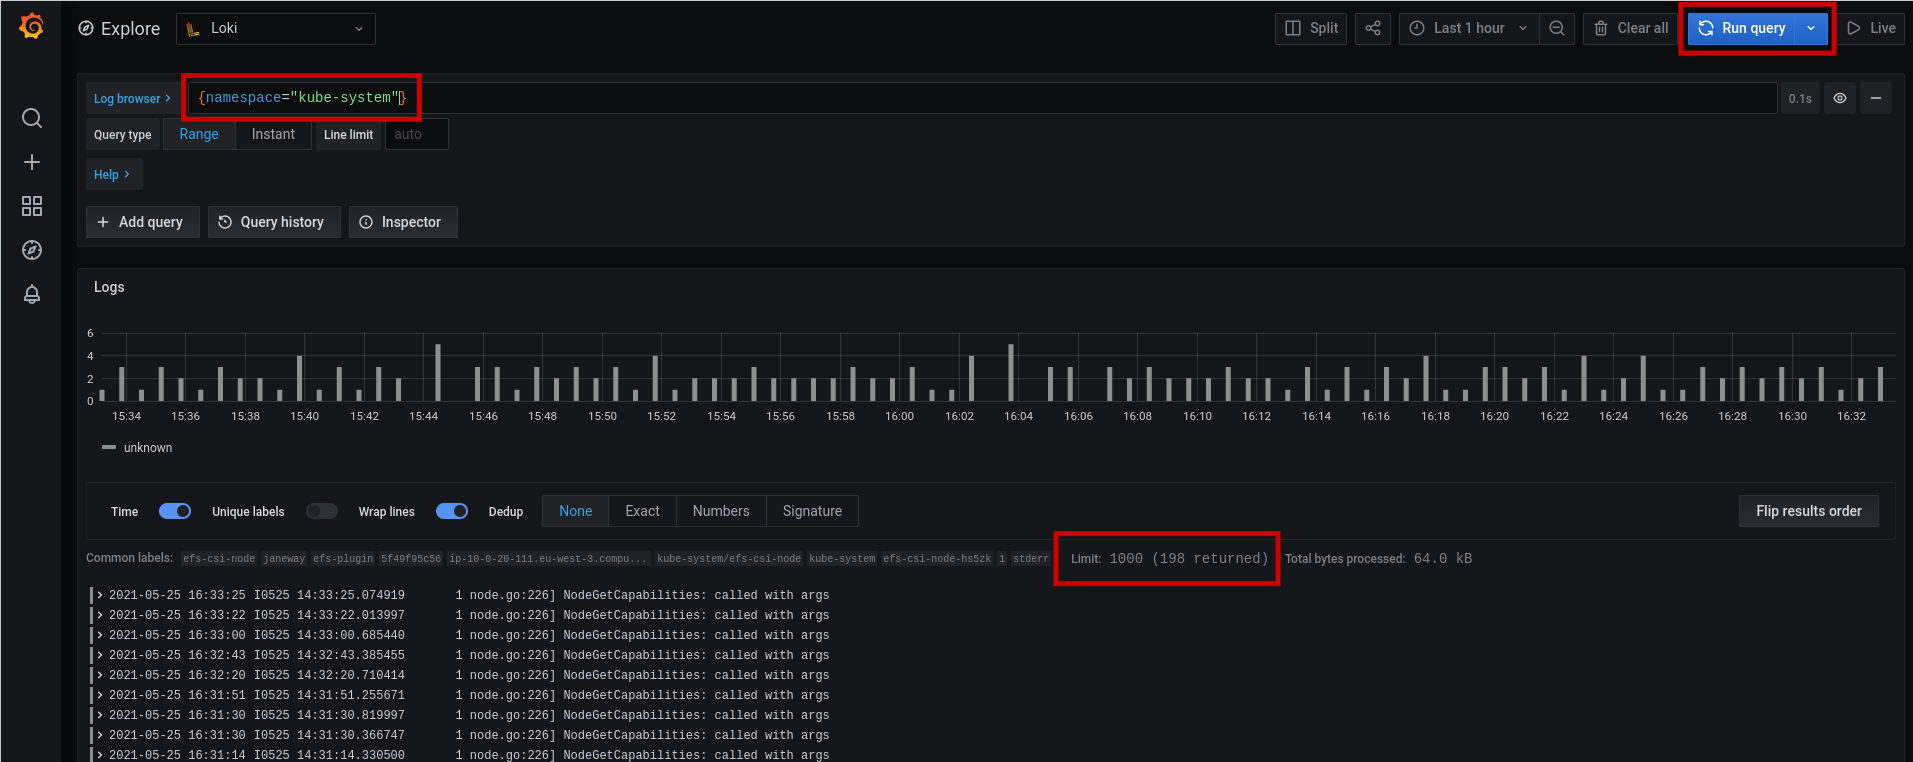
Type a LogQL expression and Run Query (blue button at top right).
Tips
Instead of clicking on Run Query, you can also type Shift-Enter on your keyboard.
Tips
In most cases, you will start with a basic expression with cc_prom_source and namespace to specify the cluster and the namespace where your logs are. Then you will improve your expressions with other labels using the Grafana auto-completion.
Warning
Note that there is a Grafana limitation on the number of log lines obtained. By default this limitation is 1000. This limitation prevents blocking Loki and/or your web browser with too many lines.
If you want to see missing logs, you can :
- increase the Grafana limit with the
Line limitbutton (a maximum number cannot be exceeded: there is also a Loki limit) - zoom on the time section where the logs may have been emitted.
Also note that there is a limitation on the search time range of the query. You can't make a request for more than 721h.
If you want to see older logs, you can shift the search time range.
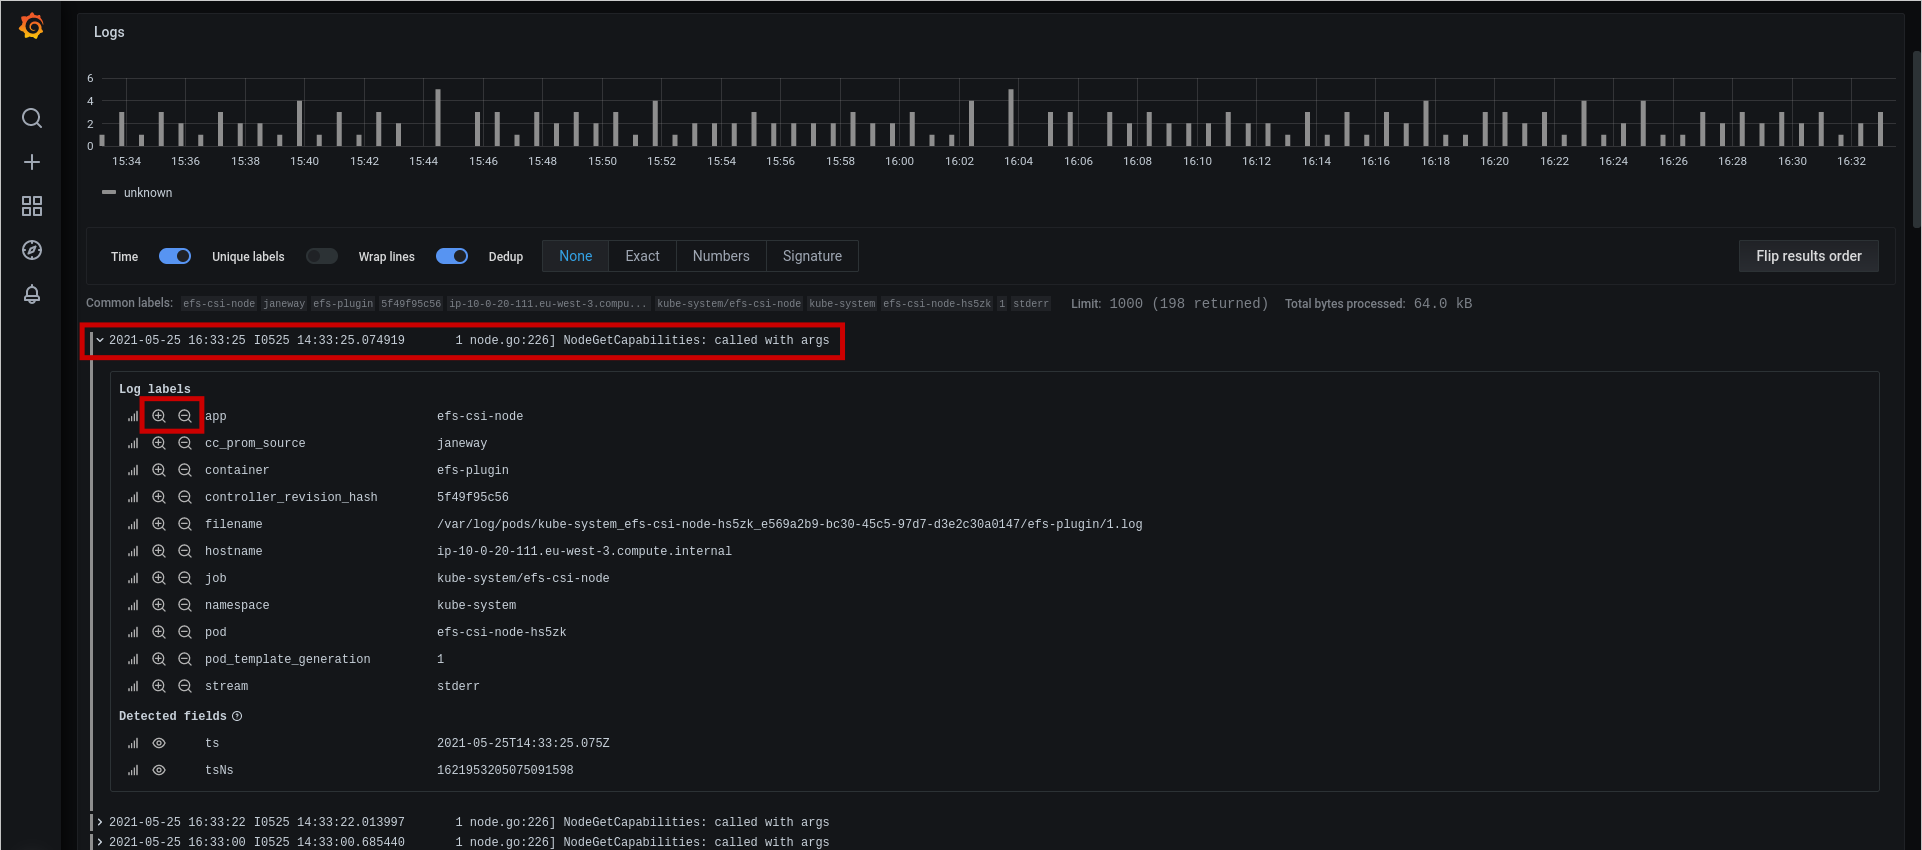
You can click on a log line to have more details :
Tips
In mose cases, after having filtered logs with common labels, you will add grep or regex filters. Examples :
{namespace="kube-system"} |= "DeadlineExceeded"will grep onDeadlineExceededword{namespace="kube-system"} |~ "code.*DeadlineExceeded"will filter on regular expressioncode.*DeadlineExceeded
Check LogQL reference for help on LogQL expressions.
Dashboards
Grafana allows grouping graphs in dashboards.
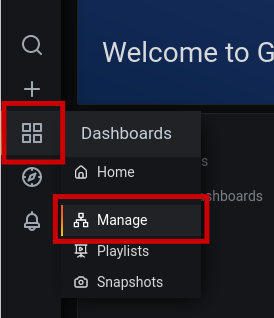
Click on Dashboards then on Manage :
You can now see the list of installed dashboards :
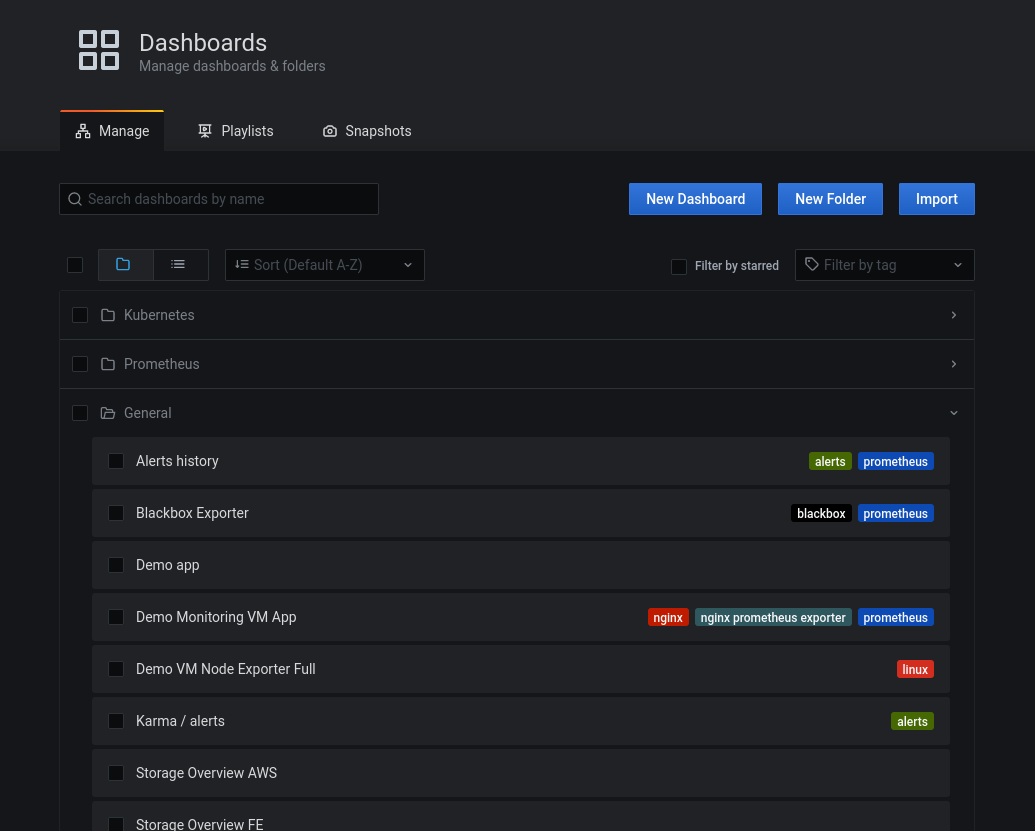
There are folders (like Kubernetes, Prometheus and General). You can click on the folders to get the list of dashboards stored there.
You can also search for a specific dashboard if you know its name (or part of its name).
Click on the wanted dashboard and you will see it.
Warning
You can create a new dashboard or import dashboard from Grafana dashboard repository. However, it is not possible to save them.
When Grafana restarts, all non-predefined dashboards are lost. Because Grafana runs on a Kubernetes® pod, restarts can happen at any time.
Tips
When you put your dasboards on https://git.ZONE_NAME.caascad.com/MonitoringApp/dashboards, Grafana will know them as pre-defined dashboards. This is the way you save a dashboard.
Grafana plugins
Grafana can be extended with plugins. If you want to add a plugin in Grafana, you can contact Caascad Support.
Downsampling
Thanos downsampling
Thanos generates downsampled metrics. The downsampled steps are :
- raw (with short retention)
- 5 min (with long retention)
- 1h (with very long retention)
There is no way to configure other steps.
In Grafana, this can be noticed on old metrics : you will not be able to have the detail of the metric points when you visualize metrics after the raw retention period.
Grafana downsampling
Grafana can also downsample metrics. This is useful for example when you have too many metrics to display, or metrics with unwanted spikes.
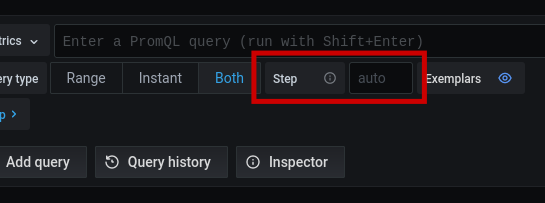
Grafana downsampling is named step and can be configured at top right step box :
