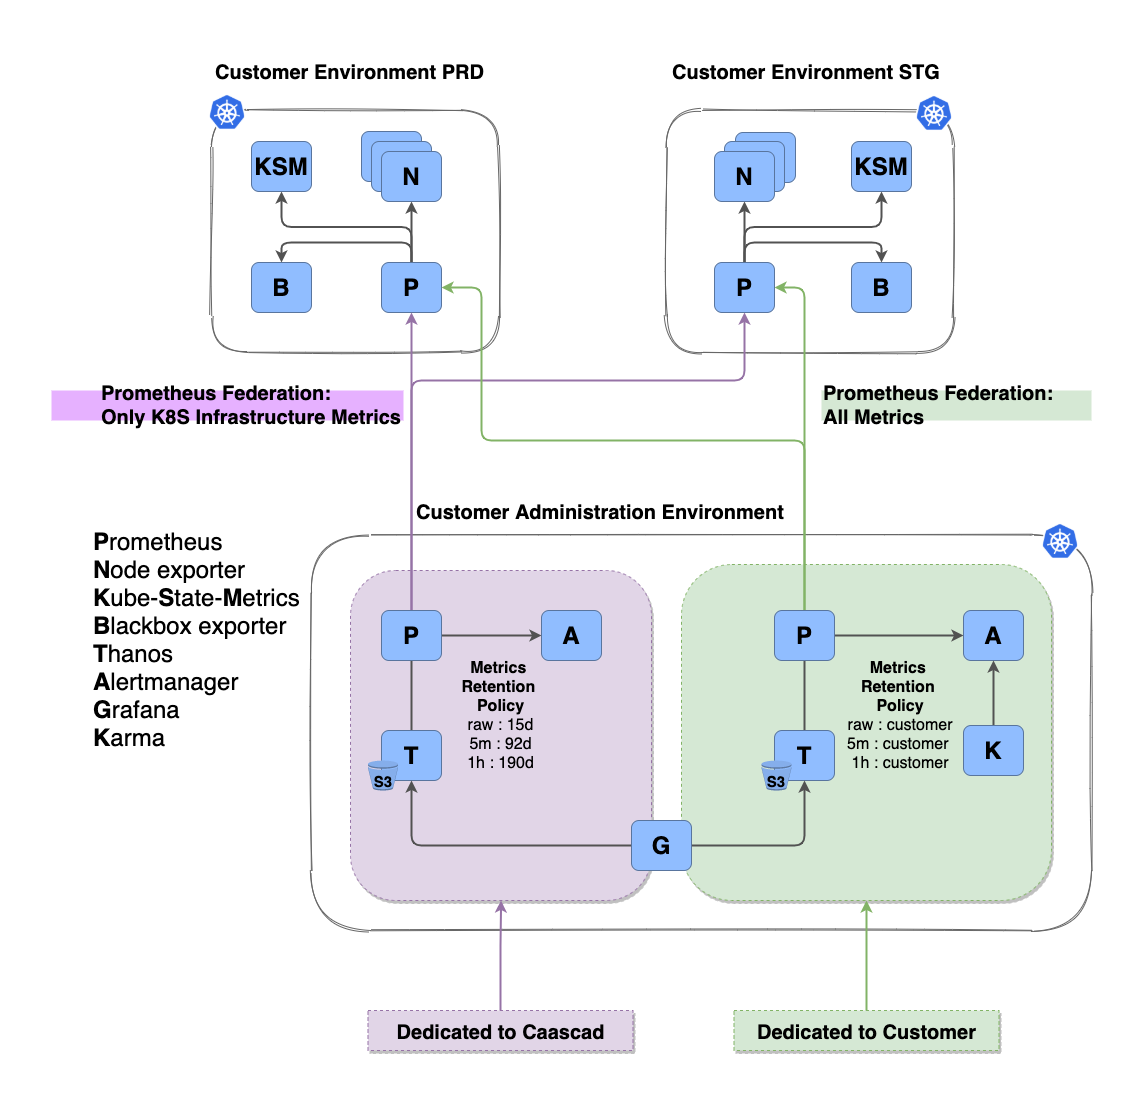
Metrics

Note
In the documentation :
- monitoring/caascad designates the grouping of tools for monitoring your Kubernetes® clusters by Caascad
- monitoring/user designates the grouping of tools dedicated to your monitoring (applications, infra...)
Prometheus-operator
Prometheus operator is a Kubernetes® operator. It is deployed on the Kubernetes® cluster and it operates Prometheus.
Deployed in:
- customer environment in
caascad-monitoringnamespace - administration environment
Prometheus
Prometheus is the monitoring tool. It scrapes everywhere it can. Then it stores the metrics and check rules for alerting. Prometheus is deployed as a Kubernetes® CRD and Prometheus-operator deploys a statefulset.app and pods.
Deployed in:
- each customer environment in
caascad-monitoringnamespace - administration environment in monitoring/caascad
- administration environment in monitoring/user
Prometheus deployed in monitoring/caascad gathers Kubernetes® metrics of the deployed Prometheus in customer environment.
Prometheus deployed in monitoring/user gathers Kubernetes® metrics and application metrics of the deployed Prometheus in customer environment.
How to
To add application metrics in Prometheus monitoring/user see How to : add servicemonitor.
Important
All metrics in Prometheus deployed in the administration environment (monitoring/caascad and monitoring/user) have the following labels:
cc_prom_source: value isCLUSTER_NAMEto identify customer environmentcc_prom: indicates which Alertmanager sends alerts (monitoring/caascad or monitoring/user)cc_client: value isZONE_NAME
Thanos
Thanos is the long term storage solution for Prometheus. Data are stored in a S3 bucket.
Thanos is made of many components:
- a sidecar for Prometheus: gets the metrics of Prometheus and stores them in the S3 bucket.
- a store gateway: be a gateway for all operations that need access to the S3 bucket (except initial storage : the sidecar does it)
- a querier: listens for queries (be a datasource for Grafana) and requests all storage places (the sidecar and the store gateway)
- a compactor: loads the data stored in S3
- compacts it
- generates downsampled data
- stores the results back in S3
Note
Thanos has other components but they are not deployed.
A schema can be found on https://github.com/thanos-io/thanos.
Deployed in:
- administration environment in monitoring/caascad
- administration environment in monitoring/user
Each tool group has a specific metrics retention policy.
See:
Exporters
Exporters are sources of metrics. They are independant pieces of software with 2 functions:
- gather the metrics from where they are (system metrics, Postgresql, NGinx...)
- expose the metrics on a HTTP server
Prometheus scrapes them by connecting to the HTTP server of the exporters.
There are many possible exporters. Applications are supposed to deploy them. However, some basic exporters are deployed with the stack:
- node exporter: get the system metrics of the operating system (CPU, mem...)
- kubelet
- ...
Several Prometheus exporters are deployed.
Node-exporter
Deployed in customer environment caascad-monitoring namespace.
See:
Kube-state-metrics
Deployed in customer environment caascad-monitoring namespace.
Allows to obtain metrics coming from Kubernetes® objects like pods, configmaps...
See:
Blackbox-exporter
Deployed in customer environment in caascad-monitoring namespace.
Allows to supervise external services (in Blackbox-exporter there are called targets).
There are 4 probes:
- http requests
- tcp requests
- dns requests
- icmp
To add an external service to monitor, you have to:
- define a target
- define a module which uses one of the 4 probes
See:
S3-usage-exporter
Limitation
At the moment this feature is implemented only for Flexible Engine.
S3-usage-exporter is a Prometheus exporter developed by Caascad Team.
Deployed in administration environment.
Allows to obtains S3 bucket size and S3 bucket object number for:
- docker registry storage backend
- logs storage backend
- metrics storage backend
Note
S3 metrics are only available in the Thanos datasource.
See:
Grafana
Deployed in administration environment.
Connected to:
- Thanos deployed in monitoring/caascad, metrics visible with the
Thanosdatasource - Thanos deployed in monitoring/user, metrics visible with the
Thanos-appdatasource
Several dashboards are deployed by default:
General/Storage S3: to view S3 metricsGeneral/Blackbox-exporter: to view probe metricsKubernetes/...: to view Kubernetes® metrics (node-exporter, kubelet, kube-state-metrics ...).
See:
Alertmanager
The Alertmanager is a router for alerts. It listens for alerts (usually from Prometheus). Some routing rules are applied and the alerts are forwarded to other tools (like mails, sms...)
Deployed and connected to Prometheus in:
- administration environment in monitoring/caascad
- administration environment in monitoring/user
PrometheusRules
Several alerting rules are deployed by default in administration environment: managed by Prometheus/Alertmanager and used by Caascad team to monitor your environments (deployed in monitoring/caascad).
Several recording rules are deployed by default in administration environment: managed by Prometheus and used in Grafana Kubernetes® dashboards (deployed in monitoring/caascad).
How to
To write PrometheusRules in monitoring/user, see How to write a PrometheusRule.
Karma
See:
Karma is a user-friendly user interface for Alertmanager. It shows alerts and helps adding silences on alerts.
Deployed and connected to Alertmanager in monitoring/user.
See:
Kthxbye
Kthxbye is an application that allows you to create renewable silences.
Deployed and connected to Alertmanager in monitoring/user.
How to
To add a silence, see How to silence an alert.
Retention Policy
Thanos retains metric data as follows:
- Data points with the same period as scrape interval at the moment of data ingestion, configured with
rawretention. - Data points with a period of 5 minutes are available for x days, configured with
5mretention. - Data points with a period of 1 hour are available for y days, configured with
1hretention.
Note
When an administration environment is provisioned, customer specific retention period is applied in monitoring/user.
If no cutomer specific retention is specified, default retention period will be applied: 15 days for raw, 30 days for 5m, 60 days for 1h.
At any time this retention can be modified through Change Request made to Caascad customer support.
Default retention in monitoring/caascad: 15 days for raw, 92 days for 5m, 190 days for 1h.